import pandas as pd
import numpy as np
dataset = pd.read_csv('datasets/50_Startups.csv')
X = dataset.iloc[ : , :-1].values
Y = dataset.iloc[ : ,  4 ].values
print('X:' + str(X[:5,:]))
print('Y:' + str(Y))
X:[[165349.2 136897.8 471784.1 'New York']
 [162597.7 151377.59 443898.53 'California']
 [153441.51 101145.55 407934.54 'Florida']
 [144372.41 118671.85 383199.62 'New York']
 [142107.34 91391.77 366168.42 'Florida']]
Y:[192261.83 191792.06 191050.39 182901.99 166187.94 156991.12 156122.51
 155752.6  152211.77 149759.96 146121.95 144259.4  141585.52 134307.35
 132602.65 129917.04 126992.93 125370.37 124266.9  122776.86 118474.03
 111313.02 110352.25 108733.99 108552.04 107404.34 105733.54 105008.31
 103282.38 101004.64  99937.59  97483.56  97427.84  96778.92  96712.8
  96479.51  90708.19  89949.14  81229.06  81005.76  78239.91  77798.83
  71498.49  69758.98  65200.33  64926.08  49490.75  42559.73  35673.41
  14681.4 ]
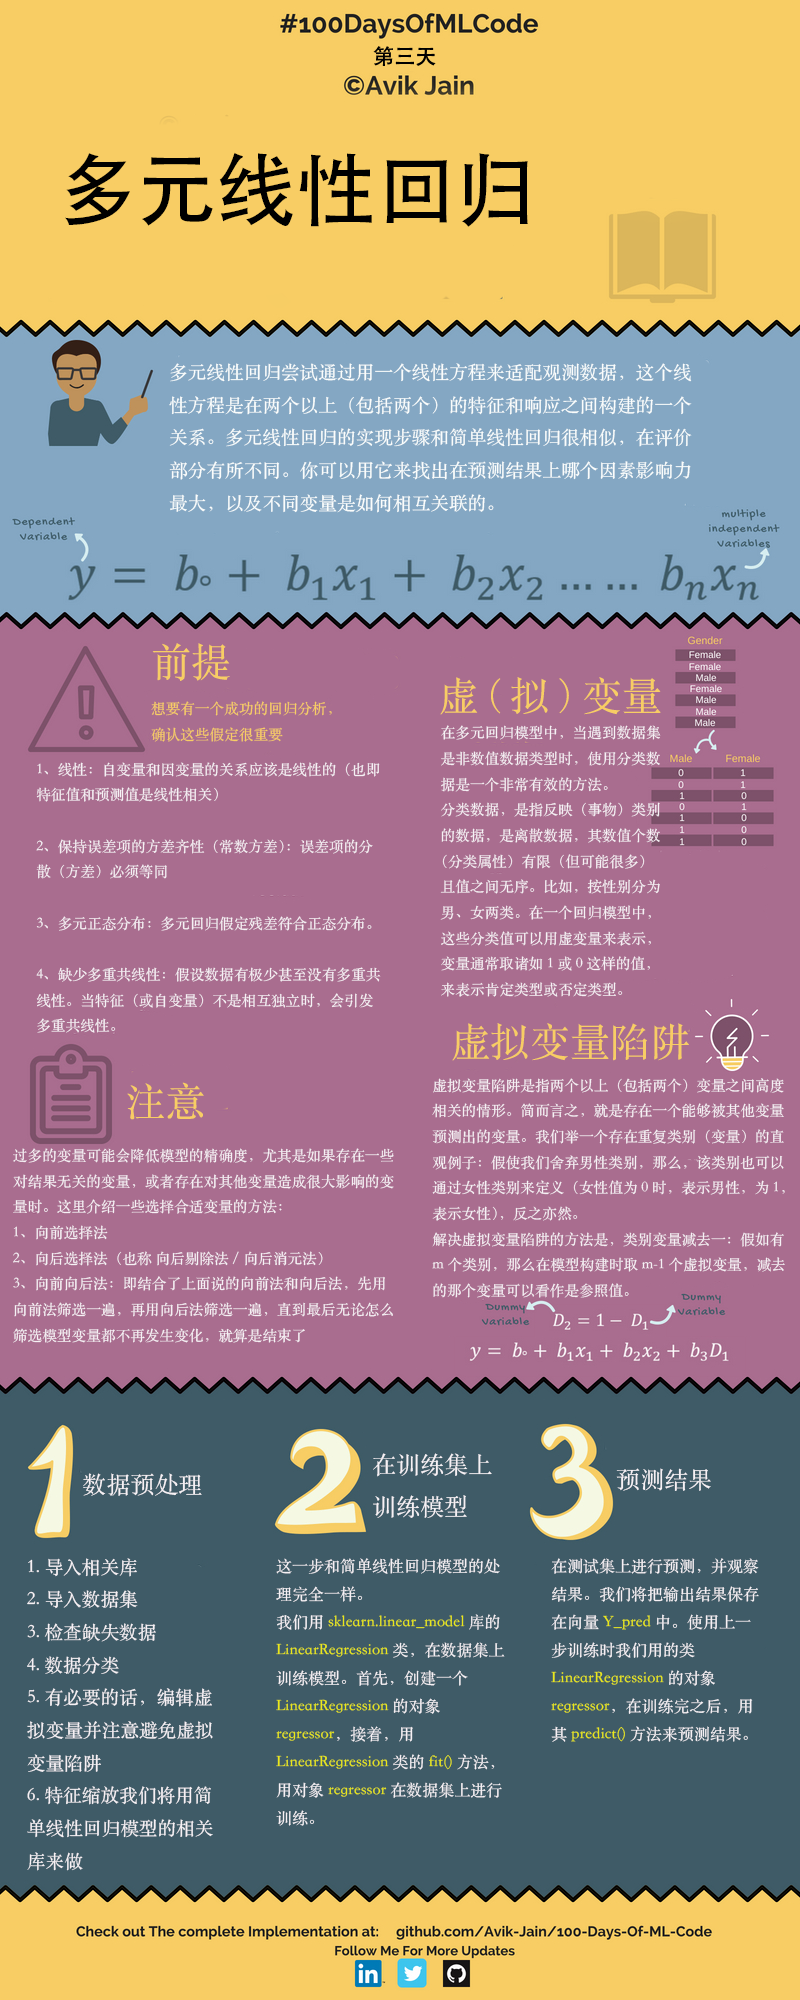
from sklearn.preprocessing import LabelEncoder, OneHotEncoder
labelencoder = LabelEncoder()
X[: , 3] = labelencoder.fit_transform(X[ : , 3])
print("X labelencoder" + str(X[: , 3]))
onehotencoder = OneHotEncoder(categorical_features = [3])
X = onehotencoder.fit_transform(X).toarray()
print('X:' + str(X.shape))
X labelencoder[0. 0. 0. 0. 0. 0. 0. 0. 0. 0. 0. 0. 0. 0. 0. 0. 0. 0. 0. 0. 0. 0. 0. 0.
 0. 0. 0. 0. 0. 0. 0. 0. 0. 0. 0. 0. 0. 0. 0. 0. 0. 0. 0. 0. 0. 0. 1. 0.
 0. 0.]
X:(50, 55)
from sklearn.model_selection import train_test_split
X_train, X_test, Y_train, Y_test = train_test_split(X, Y, test_size = 0.2, random_state = 0)
from sklearn.linear_model import LinearRegression
regressor = LinearRegression()
regressor.fit(X_train, Y_train)
y_pred = regressor.predict(X_test)

import matplotlib.pyplot as plt
plt.scatter(Y_test , Y_test, color = 'green')
plt.scatter(Y_test , y_pred, color = 'red')

